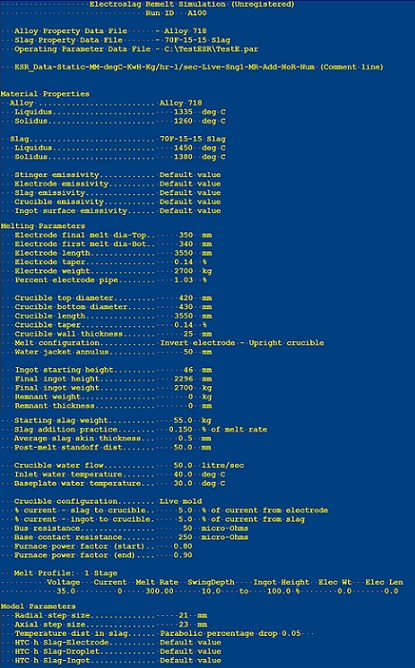
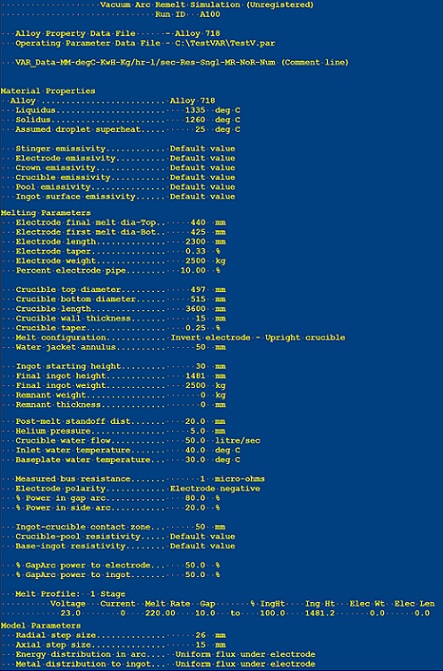
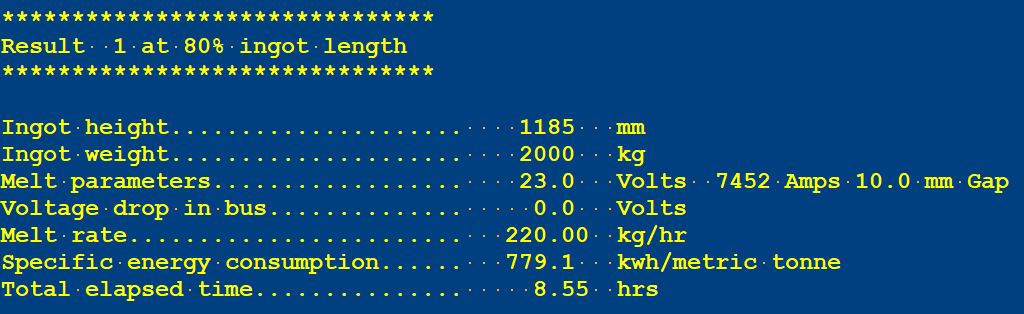
Results are presented in various formats depending on the output parameters selected. The main results file is a text file which contains all of the results for the output parameters selected. The file begins with a summary of the input data parameters as shown below.
At each specified ingot length, a summary of the operating conditions at that length is presented followed by a listing of any appropriate selected output parameters.
Results presented in a tabular format can be highlighted, copied to Excel and formatted with a space delimiter to create a table suitable for further analysis.
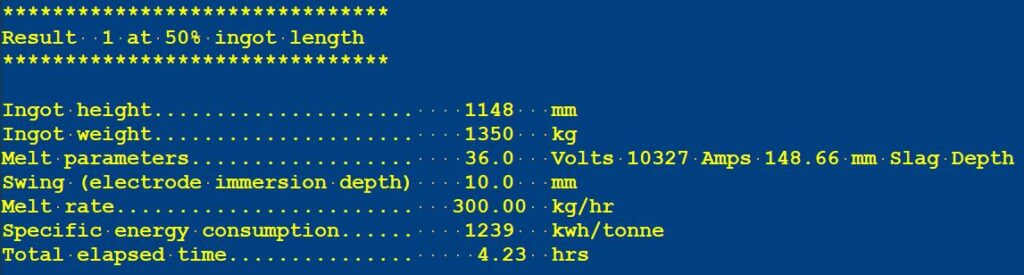
At completion of melting, a summary table of melt statistics is presented as shown below.
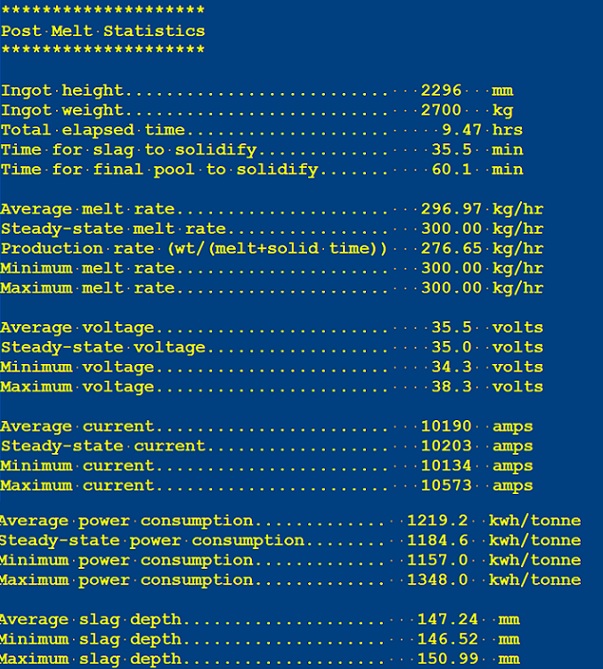
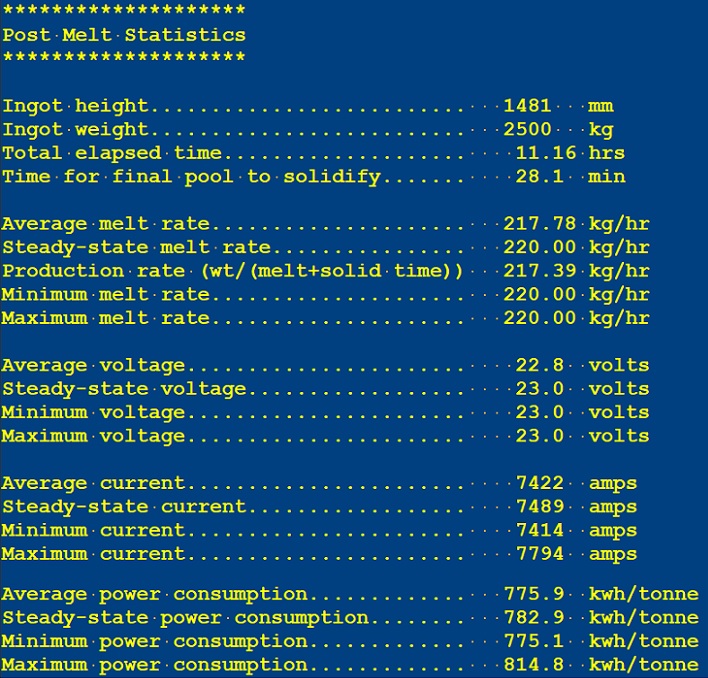
Depending upon which output parameters have been selected, the summary table will be followed by a series of tables presenting the selected output parameters as a function of the appropriate variables (ingot height, melt time, ingot position, etc.).
Whenever a results file is loaded into the Results Panel, pressing the Plots button will display an appropriate menu (shown below for VARsim) for loading a VTK file into ParaView. Parameters for which a VTK plot file has been generated are highlighted in green once ParaView has been installed and the location of the paraview.exe executable file has been specified.
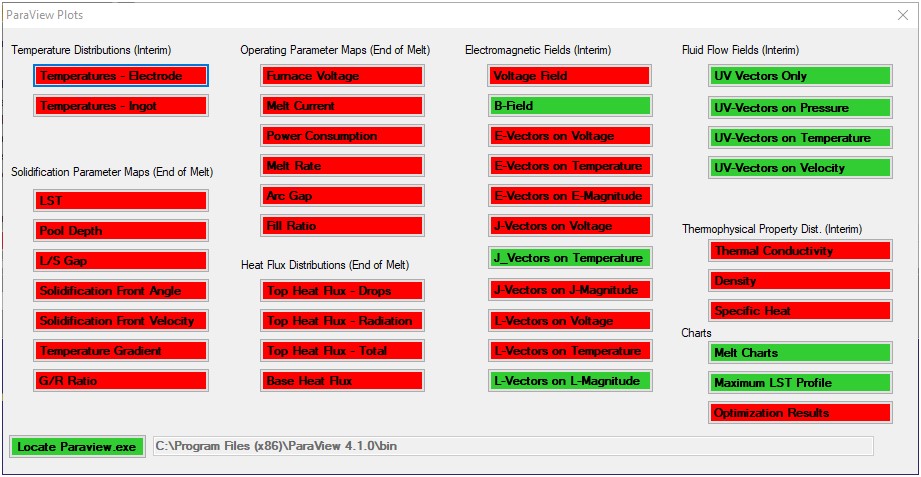
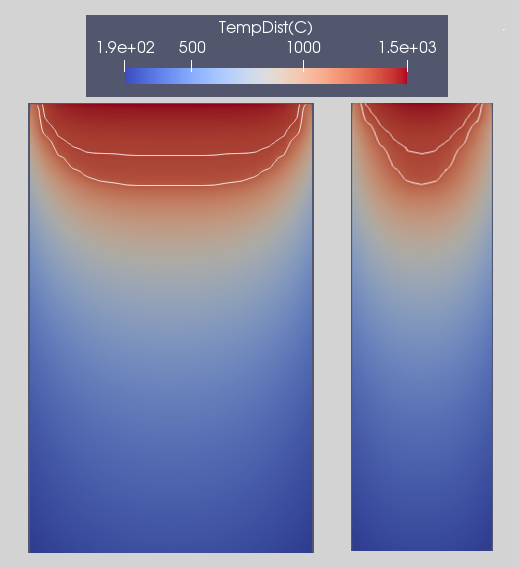
Once loaded into ParaView, plot results may be formatted as desired and displayed as shown below for the temperature field in an ESR slab.